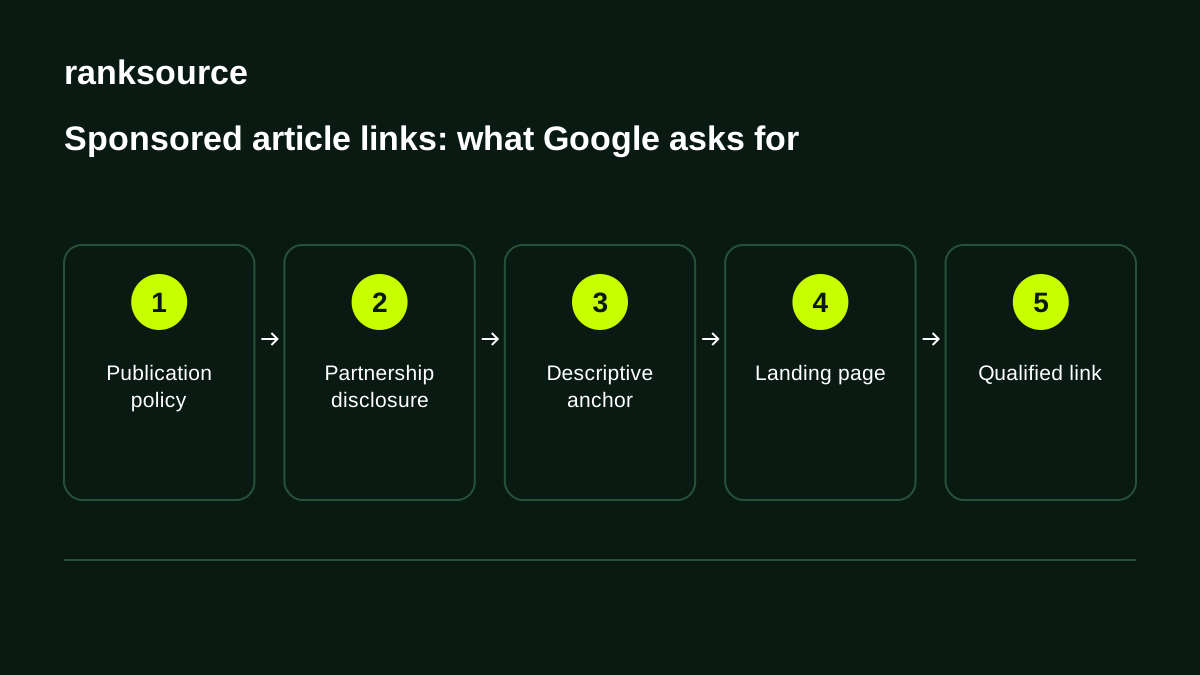
A report states that a sponsored article brought 120 visits. The figure is accurate and cleanly extracted, and the team is exactly where it started: renew with the media outlet, change the angle, rework the landing page, or stop there? A visit count describes an event. It prescribes nothing.
The review of a B2B campaign built on sponsored articles works better when it is designed as a decision tool. Each data point should attach to a question set before the order and to a choice it can inform. Without that discipline, reporting simply comments on whatever figures the tools happened to produce.
Five levels that should not be confused
Reports readily mix very different realities under the word “results”. To separate them, your tracking sheet can use five levels, noting for each the source of the data and what its absence means.
- Delivered: the URL is accessible and the approved elements are live. This establishes that the deliverable exists and says nothing about its effect.
- Exposure: reads or impressions supplied by the media owner, with the definition it uses. If the media owner does not share them, the data is unavailable, which is different from a value of zero.
- Visits: sessions coming from the campaign link on your website. They show that arrivals were measured.
- Actions: consultation of a resource, or an event defined in advance. It is observable behaviour and does not amount to purchase intent.
- Qualification: enquiries reviewed in your CRM. The sales team decides which ones fit the target.
One point deserves to be kept in mind: the analytics tool installed on your brand’s website does not describe how the article was read on the publisher’s site. Between exposure and visits lies a zone that only the media owner can shed light on, and the report is better off flagging it as such.
Set the campaign question before ordering. “Get contacts” remains vague. “Collect enquiries from industrial managers about the project presented” lets the sales team qualify consistently and set aside off-topic requests without debate. Then choose a review period shared by all publications, according to the length of your sales cycle. A reading after one week mainly detects a broken link or a failing page, while a later reading can include enquiries still in progress.
From tagging to reading the numbers
Setting up before going live
UTM parameters identify the source and campaign of traffic in Google Analytics, as the Google Analytics documentation on UTM parameters explains. Our analysis: they tell you the declared origin of a visit, they do not cover every visitor, and they demonstrate no additional effect.
The naming choice matters more than it seems. Plan one source per media outlet, a shared campaign name and a content identifier for each publication. The convention used in the example below is utm_source=media_a, utm_medium=sponsored_content, utm_campaign=maintenance_uk, utm_content=pilot_article. It is a working choice. Check in your own reports, before the article runs, that the traffic lands in the expected channel, because channel group configuration varies from one account to another.
Next, test the final link from end to end: the landing page displays, the advertised resource exists and the action chosen for measurement actually fires. Test the form itself, submission included, and note what happens depending on the choice made in the consent banner. Depending on your setup, a visitor who declines may leave no trace in your tools. Your measurement then understates reality by a proportion you do not know. Keep this limit in the review so that a missing data point is never read as a missing visit. This is a measurement caveat, not legal advice.
Finally, document any change to a form or page during the campaign. An added field or a moved button can alter the observed results regardless of the quality of the article.
Reading results after publication
Match each indicator to the content offered. Viewing a guide fits an educational objective, while a meeting request calls for a sales review. An indicator that does not correspond to the objective should not weigh on the judgement, however flattering it looks.
Always show absolute numbers beside percentages. When two enquiries become three, the relative change looks spectacular while the observations remain very few. No reference conversion rate applies to every sector or format either: a benchmark is only useful if the audience, the action measured and the method are comparable.
A worked example with two media owners
Here is a fictional example, invented to illustrate the reading and carrying no reference value. Media A generated 40 sessions, 2 actions on the resource and 1 enquiry judged relevant. Media B generated 120 sessions, 3 actions and no relevant enquiry.
The temptation is to rank them: B wins on visits, A wins on enquiries. Both readings are fragile. With one enquiry on one side and none on the other, a single extra contact would change the comparison sharply. It is better to ask what these figures make plausible and what should be checked before choosing.
- The angle of article B may have attracted curious readers, far from the need described in the resource.
- The landing page may be less readable for media B’s audience than for media A’s.
- B’s sessions may include very short visits, which a traffic quality check could isolate.
- The consent banner or the form may have behaved differently depending on the devices that dominate each audience.
Check first what you can observe: consistency of the promise, working of the form and definition of the reported data. The review then serves to choose what to test next, not to issue a ranking that the volumes cannot support.
Attribution and causal effect
Attribution allocates credit for conversions across touchpoints according to a model, as the Google Analytics guide to attribution describes. In our analysis, credit allocated by a model reflects a sharing rule. It does not prove that the sale would not have happened without the article.
In your report, name the model and the period used. Present as three separate pieces of information the sales attributed by the tool, the opportunities matched in the CRM and the voluntary statements of prospects about how they came to know the brand. The gaps between them are instructive in themselves.
Claiming that a campaign caused an increase requires a suitable evaluation method. A before and after comparison does not separate the campaign from other marketing actions, seasonality or a change in the sales team. Present it as an observation and list the other possible explanations.
Calculating return on investment also requires an explicit scope: revenue or margin, costs included, period and attribution rule. A sales amount associated with a campaign does not convert directly into profit.
A completed review with its decisions
For each publication, a short review in four headings is enough: what was delivered, what was observed, what cannot be concluded, and what you decide. Here is what the fictional example above would produce.
Media A. Delivered: article live on the planned date. Observed: 40 sessions, 2 actions, 1 relevant enquiry. Not concluded: the quality of the audience, since a single enquiry supports no trend. Decision: keep the angle among the options to test. A new publication with this media outlet can be considered if its cost and readership remain consistent with the objective, using the same tagging so that observations can be compared.
Media B. Delivered: article live, reads not disclosed. Observed: 120 sessions, 3 actions, no relevant enquiry. Not concluded: whether the gap comes from the audience, the angle or the page. Decision: clarify the landing page so that it echoes the promise of the article, then check the corrected journey. If a new run is chosen, record what changed so that differences can be interpreted.
Common next step. Reads are missing for both media owners, and this absence limits any conclusion about exposure. Decision: gather more evidence by asking for reading data, with its definition, before the next order, and by noting in the sheet what will remain unavailable.
These decisions depend on no universal threshold. They follow from what the observations allow and what they leave open. The review also protects the team or agency from a reading that is too flattering as well as from a judgement that is too harsh, and it leaves a useful trace when someone else takes over the file.
Before relaunching a campaign, compare offers and their terms in light of your missing data: the features of ranksource let you compare media offers. Confirm separately which review data each media owner agrees to share.